[Home]
Table of contents
The fallacy that I am going to discuss here had actually happened
during the days of Prof Mahalanobis. I learned about this from a
lecture by Dr C R Rao. I do not have the original data set. So
the discussion will only provide the basic idea.
Allegedly, there is a claim in astrology that the ratio of the
life line and the wrist width can predict one's life span. The
life line is the length of the diagonal across the palm ending at
the base of the index finger. There was a paper where the authors
visited various burning ghats and crematoria, and collected data
on this ratio and the age at death for different dead bodies. The
computed Pearson's correlation and found a value as high as
0.8. So they claimed that astrology has some scientific justification,
after all.
The paper had attracted the attenstion of Prof Mahalanobis, who
was particularly intrigued by the fact that the authors had not
provided a scatterplot. Merely quoting the correlation without
showing the full data (graphically) opens up the hell of
data misintrepretation. He contacted the authors, and managed to
get the raw data, which contained also the genders of the dead
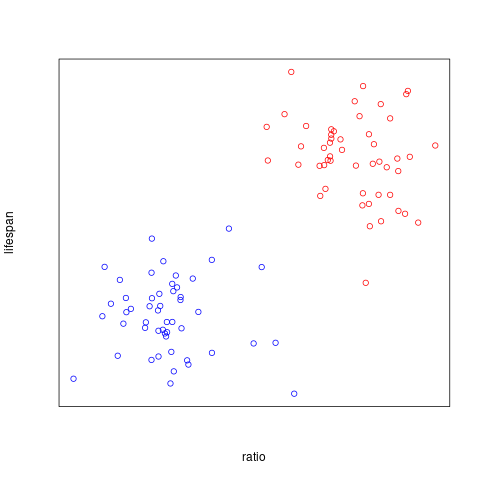
persons. The scatterplot looked something like this:
The red points correspond to the males, while the females are
shown by blue points. Notice that the cloud of points for the
males show no strong correlation. Neither does the female
cloud. Yet the two clouds being located at two different centres
create the correlation. In fact, here the male correlation is
about $-0.2$ while the female correlation is
about $-0.01$. Yet the pooled correlation is $0.8$.
Such a high correlation is an example of a spurious
correlation, meaning that it is really not there.
The interpretation of the data is that men tend to have more
squarish hands than women, and so have higher values of the
ratio. Also, during that time, a large number of women used to
die during child birth. So their life spans were shorter than
those for men.
In fact, you could have obtained a more striking paradox by
replacing the ratio with length of hair!
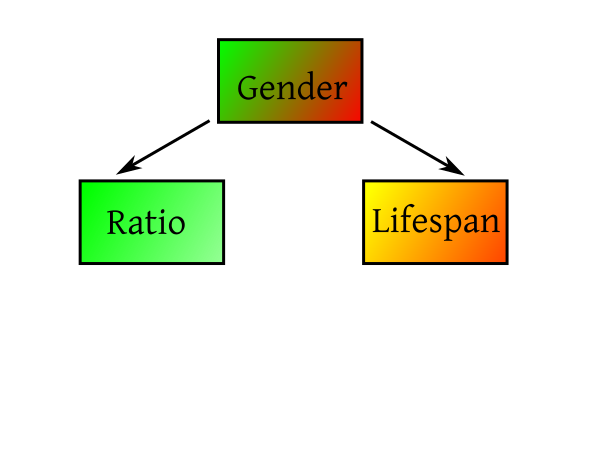
We can visualise the cause of the fallacy as the following
diagram:
The two variables Ratio and Lifespan are not directly connected
at all, but both are influenced by a common variable Gender. When
this common variable is not mentioned (as in the original paper),
the two other variables appear to have a correlation.
Such variables that influence other vsriables from behind the
scene, are called latent variables, and are at the centre
of much attention.
Statistics is all about aggregate overall behaviour. So we often
pool smaller samples with similar behaviours into a larger
sample, and expect to see that common behaviour more strongly in
the pooled data. For instance, if the mean of two univariate
samples are both between 3 and 4, then the pooled mean will also
lie in the ame interval.
However, thanks to latent variables, pooling may give rise to
wierd artefacts. The astrology fallacy is one such example. The
following problem outlies another.
EXERCISE:
We have two bivariate data sets $(X_i,Y_i)$
for $i=1,...,50$ and for $i=51,...,100$ such that each
has correlation equal to 1. Show that the pooled correlation can
be anything in $(-1,1]$.